
What is a drone solar panel inspection?
It is a flight over a solar plant or a rooftop array by a drone that carries two cameras, one that sees colour and one that sees heat, to record the state of every module. The pictures are then read, by a person or by software with a person checking, for modules that are damaged, dirty, shaded or not producing.
Module. One framed panel of solar cells behind a sheet of glass.
String. A set of modules wired in series, so that one weak module limits the rest.
Hot spot. A cell that runs much hotter than its neighbours. The report this post relies on calls them hot cells, formally named hot spots 1.
Bypass diode. A diode wired across a group of cells to reduce the effect of a hot spot. When cells are mismatched or partly shaded it carries the current in their place, and it runs warmer when it does 1.
Thermography. Imaging with an infrared camera, so that differences in temperature across a module or a field of modules become visible. It can be done without interrupting the plant 1.
What can a drone find on a solar panel?
One row per finding. Every row but the last is from the International Energy Agency's photovoltaic programme, in its review of infrared imaging in the field 1.
| The finding | What it looks like | Which camera shows it | Why it matters |
|---|---|---|---|
| The finding: Hot cell (hot spot) | One cell, or a few, far warmer than the cells around it. | Thermal | A hot spot with a strong local heat gradient can cut the module's output and, in extreme cases, lead to a smouldering fire 1. |
| The finding: Broken front glass | Cracks across the glass. Under the break, hot cells. | Colour for the cracks, thermal for the hot cells | It follows heavy impacts such as hail, or other mechanical stress, and the damage often leaves hot cells in the module 1. |
| The finding: Shading | A shadow or a deposit on part of a module: bird droppings, a plant, a mast, a building, the next row of modules. The shaded cells run hot. | Colour for the cause, thermal for the effect | The shaded cell limits the current of its whole string, and the power of the unshaded cells is dissipated in it as heat 1. |
| The finding: Soiling | A film or patches of dirt on the glass. | Colour | Dirt, like partial shade, is an artefact that has to be ruled out before a warm patch in a thermal image is read as a fault 1. |
| The finding: Heated bypass diode | A junction box, on the back of the module, warmer than the others. | Thermal | An active diode means part of that module is being bypassed, because its cells are mismatched or shaded 1. |
| The finding: A module or a string that is not producing | A whole module, or a whole row of them, slightly warmer than its neighbours. | Thermal | Sunlight that is not turned into electricity stays in the module as heat. The difference is slight and grows with the sunlight, so it is hard or impossible to see in weak light 1. |
| The finding: Hot fuse, cable or connector | A hot point at a combiner box, at an inverter's connector or along a cable. | Thermal | Heated string fuses, cables and connection points are among the main thermal abnormalities of a plant; a loose connection is one cause the report shows 1. |
| The finding: The count | Every module in every row, numbered. | Colour | It is the inventory that every other finding is located against: which module, in which row, of how many. |
The table says what an inspection can show. It is not a list of what any product of ours finds; see “What this is not”.
Why is a solar plant inspected from the air?
The aim of a thermographic inspection is to find failures before they reduce the yield or do serious damage 1. On a large plant that means looking at every module, and the modules are many and alike.
The same report describes inspection by drone as a way to do this for whole plants, and reports early studies in which aerial thermography was a less time-consuming way to find faults on large plants than inspection from the ground 1. It also notes that a camera suited to hand-held work is not always suited to a survey from the air, because the lenses and the distances differ 1.
The weather decides when to fly. For good thermal images the report recommends high solar irradiance, above 600 watts per square metre, and constant conditions: no clouds, low wind, a stable air temperature. A module takes some minutes to settle after the light or the wind changes 1.
There is an international technical specification for this work: IEC TS 62446-3:2017, whose title names outdoor infrared thermography of photovoltaic modules and plants, and whose abstract describes it as defining outdoor thermographic inspection of modules and plants in operation 2. We have read its title and abstract and not the standard itself, so this post describes nothing inside it.
What does a vision model have to see?
A model that is to help with this job has six hard things to get right. None of them is about being clever. All of them are about not being wrong in a way that sends a crew to the wrong module.
Every rectangle, once. Counting needs the outline of each module, including the ones at the edge of a frame and the ones partly hidden by a rail or a neighbour, and it needs each to be counted in one picture only.
A reflection is not a fault. Clouds, buildings and trees reflect in the glass and can distort a thermal image; the report's remedy is to wait for stable conditions or move the camera 1. A model has to tell a reflection that moves with the camera from heat that stays with the cell.
Dirt and shade are causes, not faults in the module. A hot cell under a bird dropping is a cleaning job. The same hot cell with nothing on the glass is a different job. Only the two pictures together can say which 1.
Small differences. A string that is not producing is only slightly warmer than one that is, and the difference shrinks in weak light 1. A threshold that is right in strong light is wrong in weak light.
The angle of view. The report gives its typical values for glass only within a range of viewing angles 1. A picture taken too flat cannot be read the same way.
Two cameras, one module. The colour picture and the thermal picture have to be matched to the same numbered module, or the finding cannot be acted on.
Where would this job sit in our stack?
With Drashta, and it is not a job Drashta does today. Drashta (द्रष्टा, “the seer”) is ShepHertz’s machine-vision family. Today it reads satellite imagery offline and finds objects of interest, such as aircraft and buildings, handing analysts structured findings to review.
The Drashta page lists vision for inspection under what comes next, and says we are looking for design partners for it. That is where solar inspection stands with us: next, with a partner, and not built.
The shape would be the one Drashta has today. A model would hand a person structured findings, what it saw and where, and the person would check them and decide what they mean. For this job “where” means the array, the row and the position of the module, and the person is the one who signs the report.
Reading the pictures on the drone itself, while it flies, is further off. The same page calls perception on the machine next, not now.
The other two families do different jobs. Tatva turns plain language into exactly one machine command, and Sanjaya is fleet and telemetry intelligence. Neither reads pictures.
What exists today, and what does not
For solar, the work we can describe here is a generator of pictures.
We have built a generator that renders drone-view pictures of a neighbourhood with rooftop solar arrays from a seed number, and every picture comes with exact labels. In those pictures every module is its own labelled object, and the labels come from the scene itself, not from a person drawing boxes.
The generator plants thermal hot spots (one cell, a few cells, a bypass-diode string or a whole module), cracks (an impact crack or shattered glass), soiling (a dust band, dirt patches, bird droppings), missing modules, and shading from trees, water tanks and neighbouring structures.
Each picture is rendered twice from the same camera, once in normal colour and once as a pseudo-thermal view. The generator's thermal view is a physically motivated approximation and is not radiometric.
Every picture the generator makes is our own render; no third-party photograph goes into it.
What we cannot show you is a result from a real site. The demo's module, crack, soiling and hot-cell drawing comes from that generator, and nothing in the demo was tested on a real solar site.
The demo: a simulated flight over an invented solar site
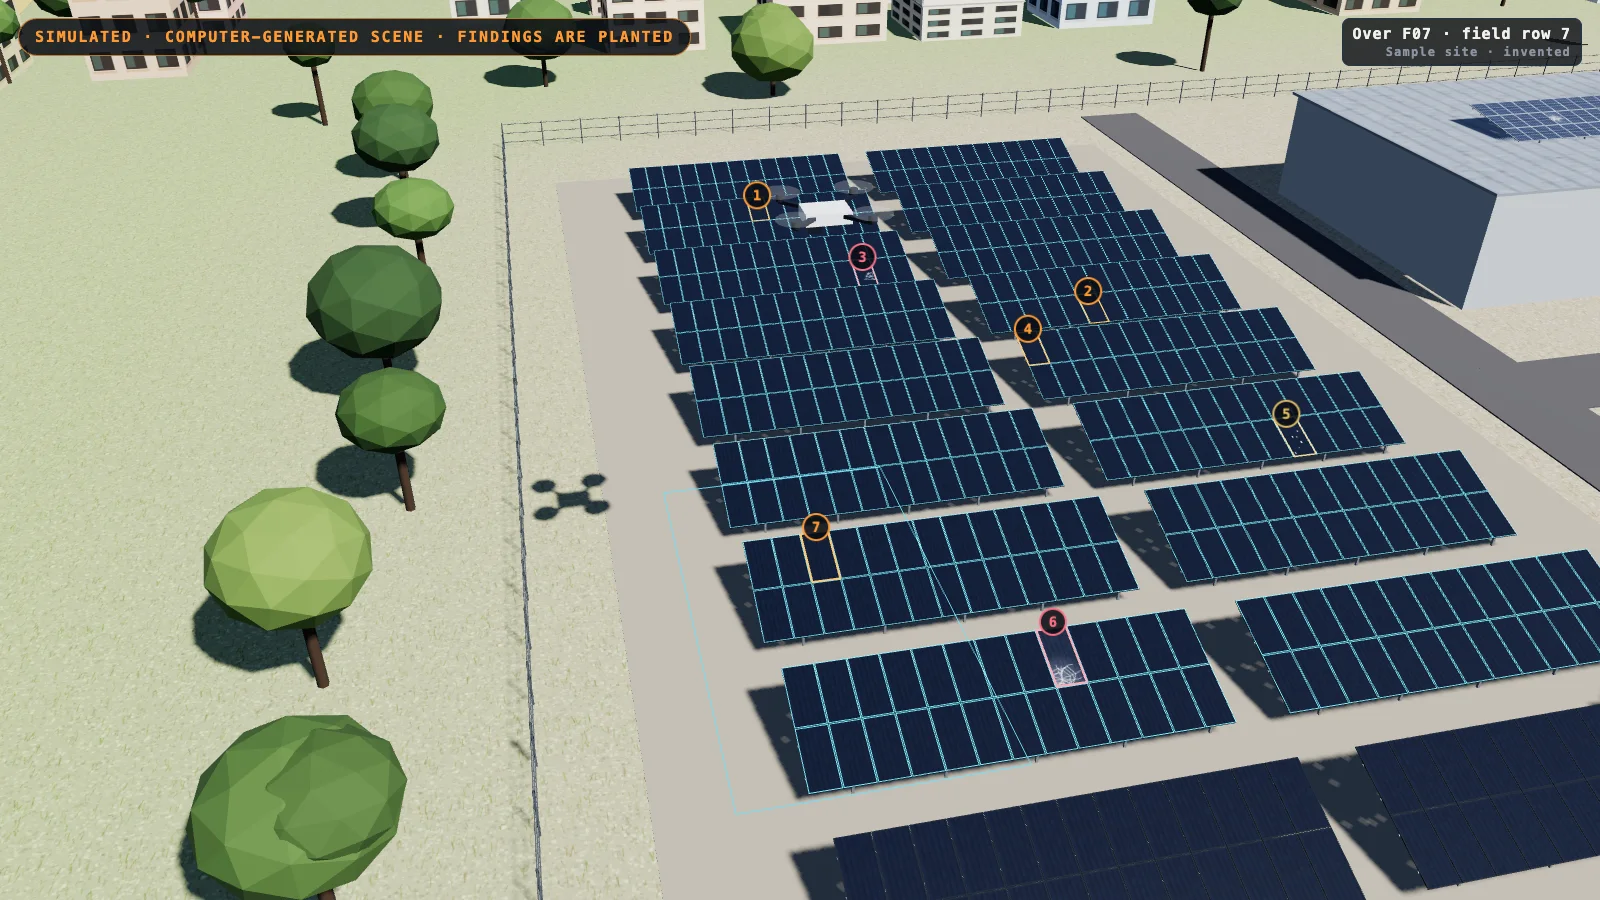
Simulated. The scene is computer-generated and the findings shown are the ones planted in it; no model produced them. You can open the simulated demo in a browser; the pictures here are stills from it, and each carries the tag “SIMULATED” inside the picture.
The demo is a simulated drone inspection of an invented solar site: a ground-mounted field of module tables and four rooftop arrays. The site in the demo has 564 module slots in 13 arrays, and 563 modules are present because one slot is planted empty.
A drone flies back and forth over the field and then over the roofs, and each module is outlined and counted as the drone passes it, by array and in total. The visitor can switch between a normal-colour view, a thermal view, and a split view with a divider that can be dragged.
The demo plants five kinds of finding: hot spot, cracked glass, soiling, shading, and a missing module. It starts with fifteen planted findings.
Hot spots in the demo come in four patterns: one hot cell, two or three hot cells, one bypass-diode string, or a whole module running warm. Cracked glass is shown as an impact crack or as fully shattered glass; soiling as a dust band on the low edge, bird droppings, or a dirt patch. The two shading findings are a tree and a water tank on a stand.
In the demo a hot spot shows in the thermal view and not in the colour view, apart from a faint burn mark on a hot cell; cracks and soiling show in both.
Every finding is listed with its array, row and position, so a person on the ground could walk to it. The visitor can plant a new defect on a random module, or clear any planted finding, and the count and the list change with it. The list turns into a one-screen inspection sheet that can be printed: counts, the count by array, and each finding with a suggested next step.
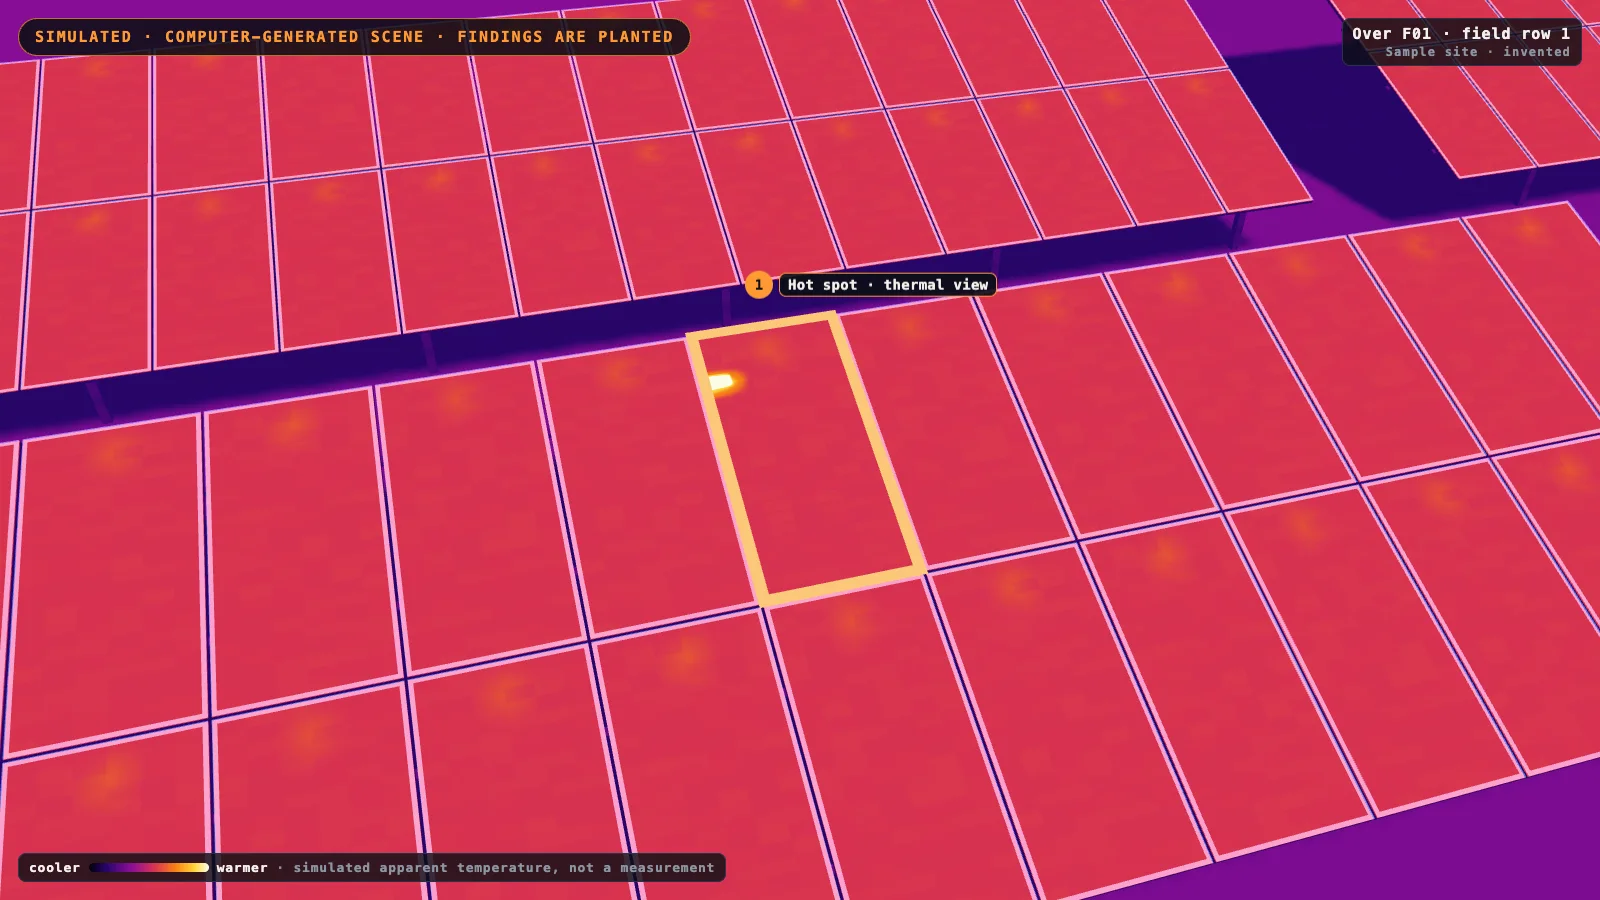
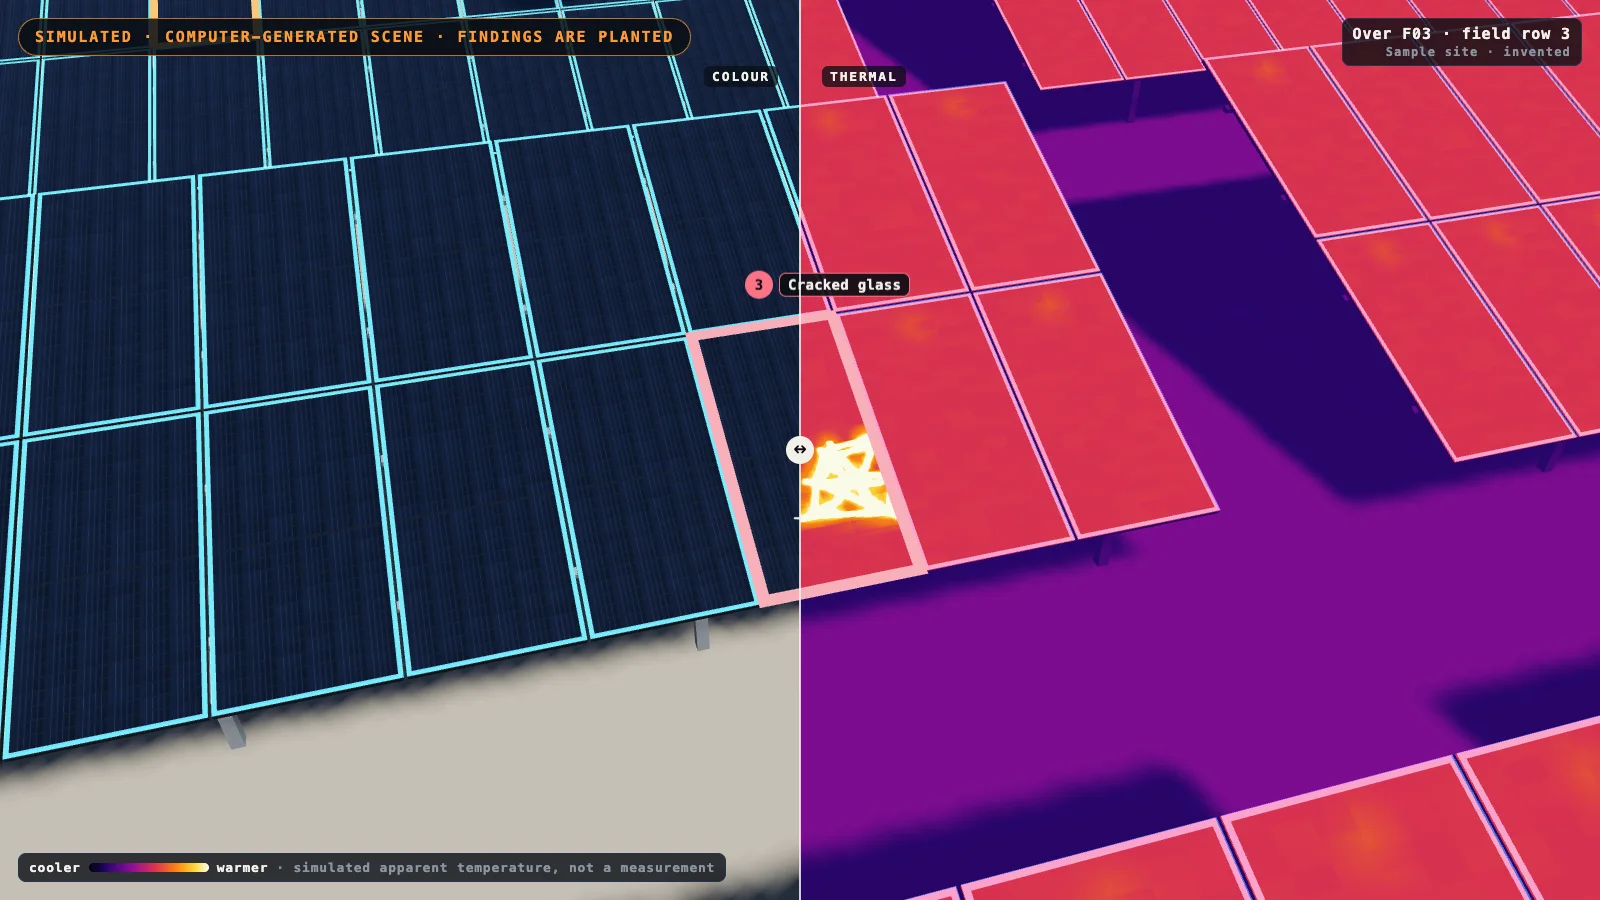
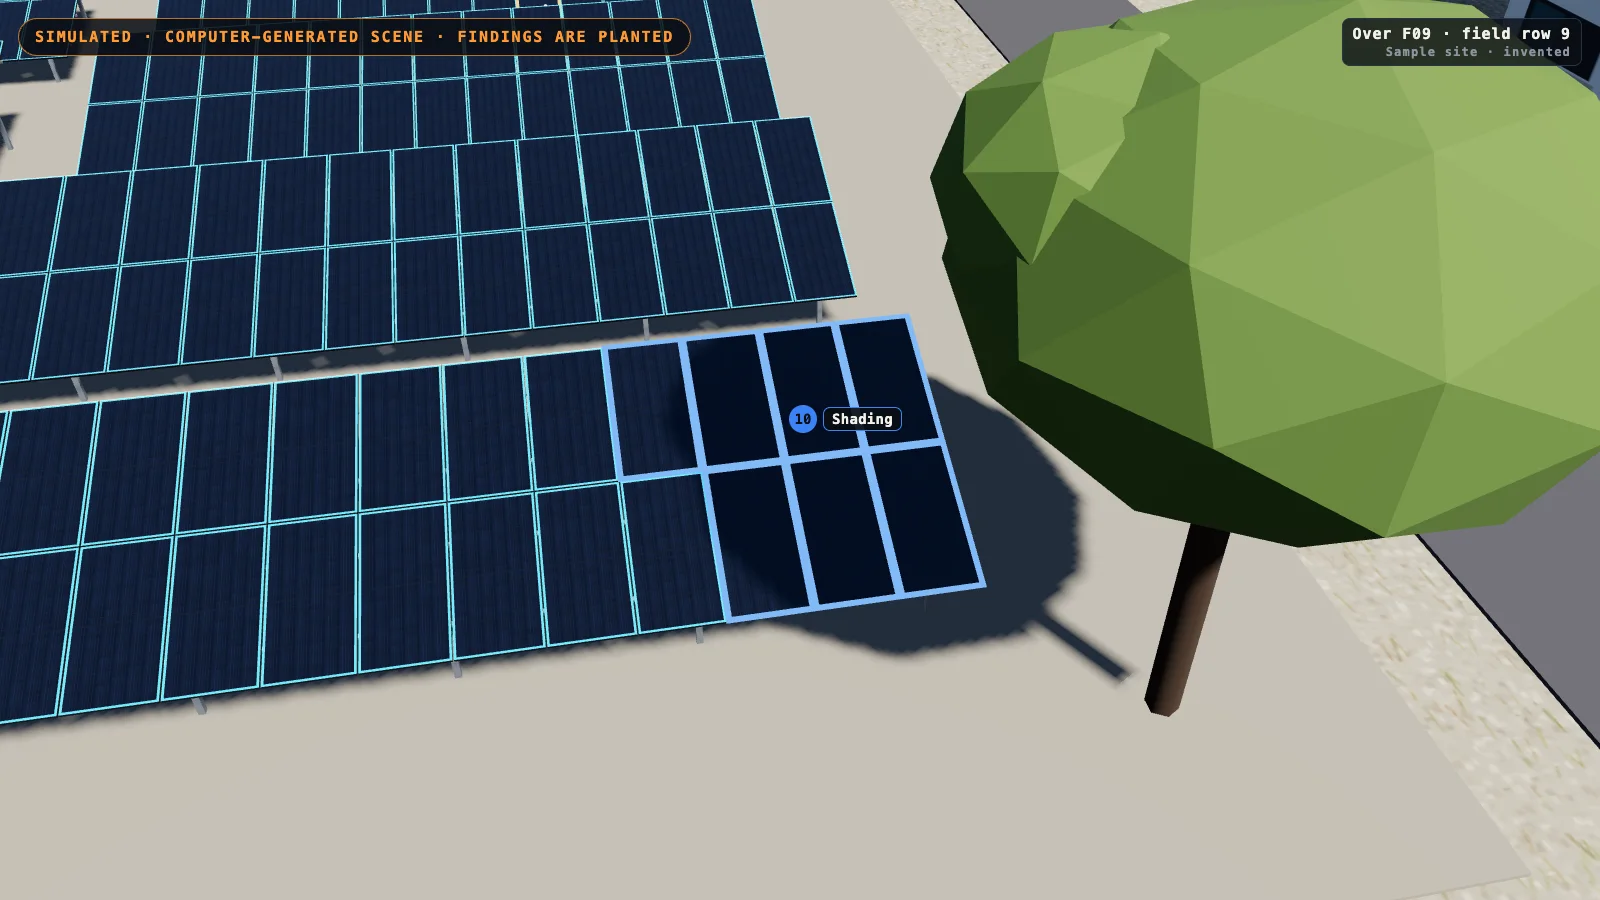
What is simulated in the demo, and where does it stop?
The list of findings is read from the scene itself, not from the picture: the page planted each defect, so it knows where each one is. An inspection model has to do the reverse, which is why the demo shows the job and proves nothing about doing it.
Shading is the one finding that is worked out rather than placed by hand: the page tests whether the planted tree or tank blocks the sun from each module, and lists a module when at least a quarter of it is in shadow.
The thermal view is a simple model, ambient temperature plus sunlight plus the heat we planted, and it is not a measurement. The thermal view does not model reflections, wind cooling or the time a module takes to heat up, which are things the review above says a real thermal survey has to manage 1.
Partial shade in the demo only cools the shaded part; it does not reproduce the heating that shaded cells can show in real thermal images.
The site is invented and far tidier than a real one: no dust haze on the lens, no glare, no wind, no missing GPS fix. The drone in the demo is a marker for where the flight has reached, drawn larger than life; the demo says nothing about flight time, battery or permissions.
The whole demo runs in the visitor's browser and makes no request to any other server.
What rules apply to the flight in India?
The inspection is a flight, and in India a flight by a drone falls under the Drone Rules, 2021. The Ministry of Civil Aviation's release on those rules describes an airspace map on its Digital Sky platform with green, yellow and red zones 3.
No permission is required to operate a drone in a green zone, which the release defines as the airspace up to 400 feet, or 120 metres, that is not marked red or yellow, and up to 200 feet between 8 and 12 kilometres from the perimeter of an operational airport 3. A rooftop in a city may sit outside a green zone, so the zone is the first thing to check for a site.
The same release says a type certificate is required when a drone is to be operated in India, with exemptions it lists; research bodies flying in a green zone on their own premises are among those it exempts from the type certificate and from the unique identification number 3.
That release is from 2021 and the rules have been amended since. Check the current rules and the map before any flight; this section is a description, not advice.
What this is not
It is not something we offer. ShepHertz does not offer solar inspection today: the demo on this page is computer-generated, the findings in it are the ones planted in the scene, no model produced them, and nothing has been run on a real site.
It is not what Drashta does today. Drashta is ShepHertz's machine-vision family. Today it finds aircraft and buildings in satellite imagery; inspecting solar plants, pipelines or power lines is not something it does yet.
It comes with no figure. We give no accuracy, speed, coverage or saving figure, because we have none to give for this work.
It is not a thermographer. Reading a thermal image as a fault is skilled work with its own conditions and artefacts, as the table above shows. A vision model that helped would hand findings to a person, who decides.
It is not an electrical test. A camera shows temperature and appearance. It does not measure what a module produces.
It is not a customer story. No plant, rooftop, owner or operator is described here, and none has used our software for this.
Frequently asked questions
Can a drone find hot spots on solar panels?
Yes. A drone carrying a thermal camera can show a hot spot, which is a cell far warmer than the cells around it. The International Energy Agency's photovoltaic programme lists hot cells first among the main thermal abnormalities of a plant, caused by broken front glass, by shading or by a fault inside the cell 1.
What does a thermal camera show on a solar panel?
Differences in temperature across a module and across a field of modules. Hot cells, heated bypass diodes, heated string fuses and heated cables and connection points all show as warm areas, and a module or string that is not producing shows slightly warmer than its neighbours 1.
Can a drone detect broken or cracked glass on a solar module?
Broken front glass shows in a colour picture as cracks, and often in a thermal picture as hot cells under the break. The damage follows heavy impacts such as hail or other mechanical stress 1.
How does a drone count solar panels?
By photographing every row in colour and having each module's outline found once and numbered. The count is the inventory that every other finding is located against: which module, in which row, of how many.
When should a thermal inspection of solar panels be flown?
In strong, steady sunlight. The International Energy Agency's review recommends irradiance above 600 watts per square metre with no clouds, low wind and a stable air temperature, because a module needs some minutes to settle after conditions change 1.
Is there a standard for thermal inspection of solar plants?
Yes. IEC TS 62446-3:2017 is the International Electrotechnical Commission's technical specification on outdoor infrared thermography of photovoltaic modules and plants. Its abstract describes it as defining outdoor thermographic inspection of modules and plants in operation 2.
Does ShepHertz offer solar panel defect detection?
Not today. ShepHertz does not offer solar inspection today: the demo on this page is computer-generated, the findings in it are the ones planted in the scene, no model produced them, and nothing has been run on a real site.
Do you need permission to fly a drone over a solar plant in India?
It depends on where the plant is. Under the Drone Rules, 2021, as the Ministry of Civil Aviation's release describes them, no permission is required to operate a drone in a green zone of the Digital Sky airspace map 3. A site outside a green zone is a different case, and the rules have been amended since 2021, so check the current rules and the map.
Sources
Sources as read on 13 October 2026.
- 1International Energy Agency Photovoltaic Power Systems Programme, Task 13: Review on Infrared and Electroluminescence Imaging for PV Field Applications, Report IEA-PVPS T13-10:2018, March 2018; section 2.3.1 for the thermal abnormalities, and the executive summary for the conditions.
- 2International Electrotechnical Commission: IEC TS 62446-3:2017, Photovoltaic (PV) systems, Requirements for testing, documentation and maintenance, Part 3: Photovoltaic modules and plants, Outdoor infrared thermography; the catalogue page's title and abstract only.
- 3Press Information Bureau, Ministry of Civil Aviation, Government of India: Ministry of Civil Aviation notifies liberalised Drone Rules, 2021, 26 August 2021.
Written by
AgentAnywhere Research
The team that builds the platform and the models
AgentAnywhere Research writes about the platform, the model families and the trust layer we build and run in India. Where a figure is ours, it says what it covers; where something is a demonstration, it says so.