
Simulated. The scene is computer-generated and the findings shown are the ones planted in it; no model produced them.
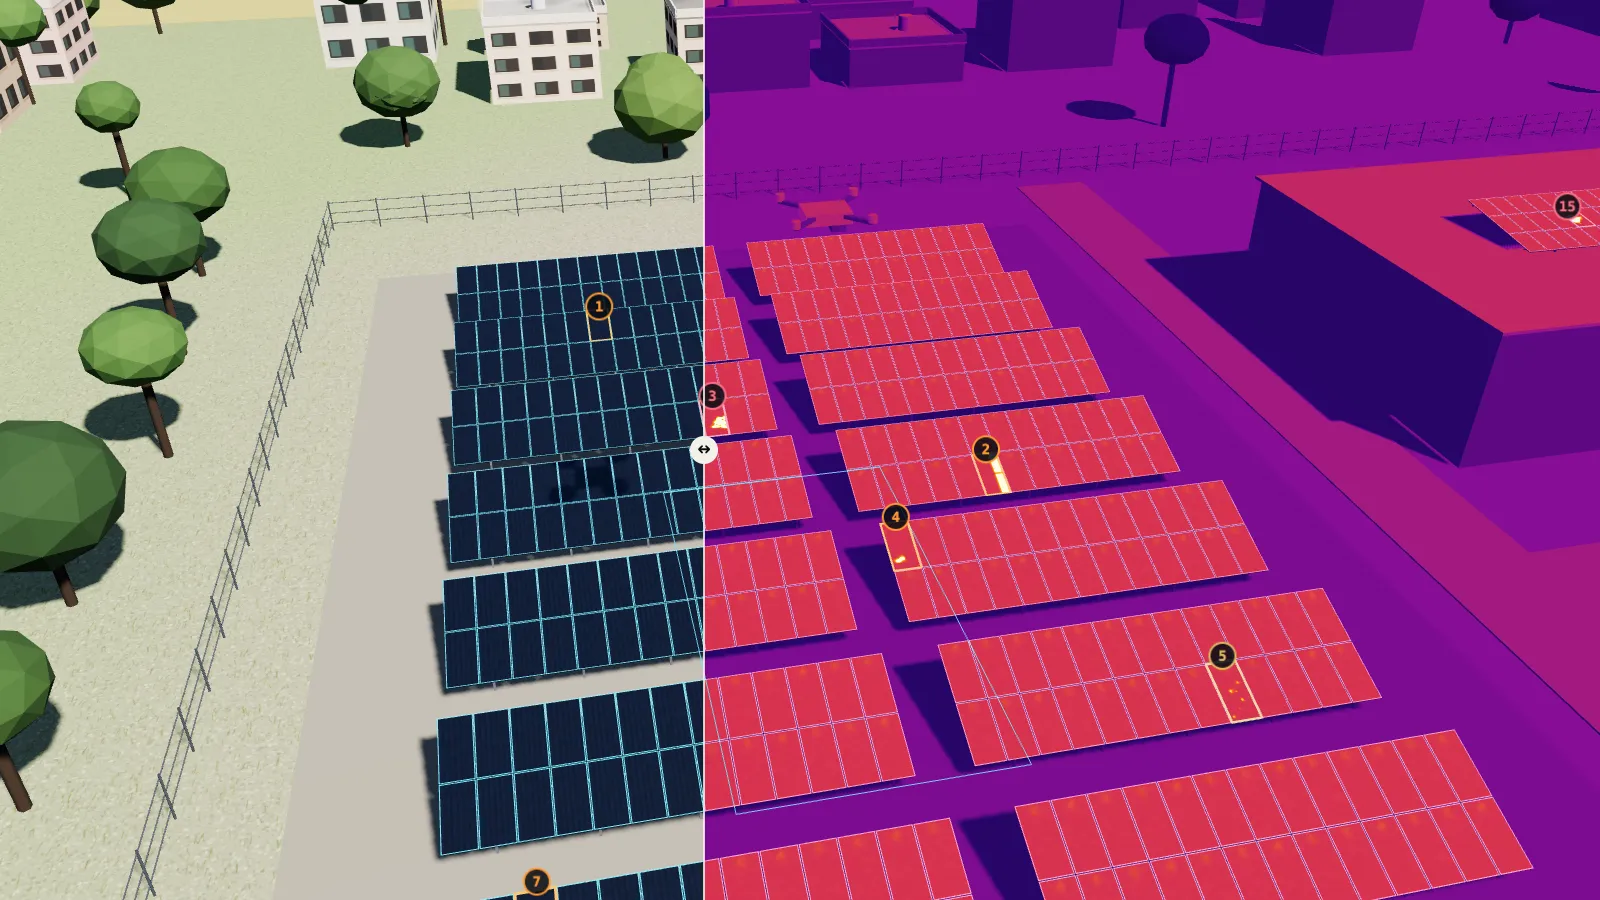
A drone flies back and forth over an invented solar site: a ground-mounted field and four rooftop arrays. As it passes, each module is outlined and counted, by array and in total. Switch between the colour view and a thermal view to see the planted defects: hot cells and hot modules, cracked and shattered glass, soiling, shading and a missing module. Each one is listed by array, row and position, and the list becomes a one-screen report for a maintenance team.
What this demo shows
Count first, then defects by place
- Every module on the site outlined and counted, by array and in total.
- Planted defects of five kinds: hot spot, cracked glass, soiling, shading, missing module.
- Where each one is: array, row and position, so a person on the ground can walk to it.
- A one-screen inspection report built from the same list.
What is simulated
All of it
The site, the drone, the flight and both camera views are drawn in your browser. The findings are the ones this page planted in the scene, so the list is read from the scene itself and not from the picture. No trained model runs here, and nothing on this page was tested on a real solar site.
Limits to keep in mind
A picture of the job, not a result
The thermal view is a simple model: ambient temperature, plus sunlight, plus the heat we planted. It is not a measurement. Shading is worked out from the sun's direction and the planted tree and water tank. There are no accuracy, speed or coverage figures here, because nothing was measured.
AgentAnywhere · ShepHertz. The site and every name on this page are invented.